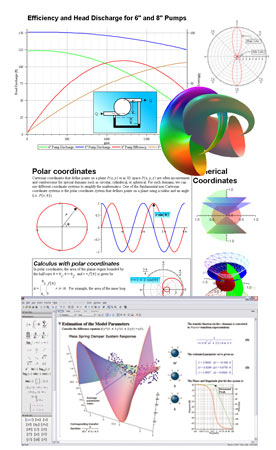
In Maple, you can customize and annotate plots easily using the Plot Builder Assistant, context-sensitive menus, or options in plot commands.
Options for controlling the appearance of 2-D and 3-D plots and animations include:
- Typeset text and mathematical expressions in titles, legends, plot labels, tickmark labels, and axis labels
- Extensive plot annotation tools, including sketching, typing, and drawing of lines, arrows, and shapes on plots
- Control over tickmark spacing and the generation of subticks, including the ability to place tickmarks at multiples of π
- Control over ranges, color, linestyle, point style, axis style, gridlines, legend placement, and more
- Control over surface style, lighting, glossiness, transparency, shading, projection, orientation, and axis color for 3-D plots and animations
- International (non-English) characters supported
- Interactive plot manipulators: zooming, panning, point probe (2-D) and real-time rotation (3-D)


